Messaging Statistics
Overview
Have you ever wanted to gather data on the status of your messages but do not want to go through the hassle of checking each message individually? SignalWire hopes that all of our customers are able to utilize our products to revolutionize telecom and it all begins with successful delivery. If you share this sentiment with us then look no further as we dive into a few statistical methods to help further analyze the activity within your SignalWire Space.
Full code example: Messaging Statistics
- Python
- Node
from signalwire.rest import Client as signalwire_client
import matplotlib.pyplot as plt
import pandas as pd
from datetime import datetime
client = signalwire_client("AAAAAAAA-BBBB-CCCC-DDDD-EEEEEEEEEEEE", "PTXXXXXXXXXXXXXXXXXXXXXXXXXXXXXXXXXXXXXXXXXXXX", signalwire_space_url = 'EXAMPLE.signalwire.com')
all_messages = client.messages.list(
date_sent=datetime(2021, 5, 14, 0, 0),
)
all=[]
for record in all_messages:
all.append((record.status))
total_sent=int(all.count("sent"))
total_received=int(all.count("received"))
total_delivered=int(all.count("delivered"))
total_undelivered=int(all.count("undelivered"))
num_outbound_messages = total_sent + total_delivered + total_undelivered
num_inbound_messages = total_received
inbound_outbound = [num_inbound_messages , num_outbound_messages]
my_colors = [ 'blue', 'grey']
vs_label = ['Inbound', 'Outbound']
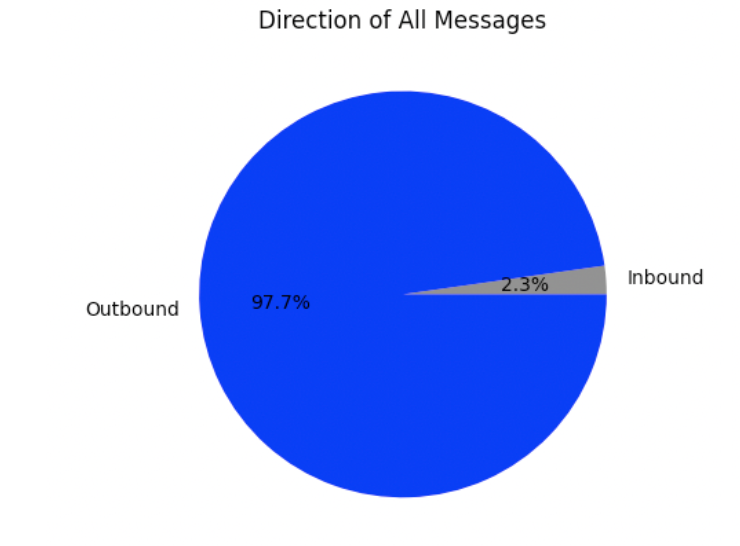
plt.pie( inbound_outbound, colors= my_colors , autopct='%1.1f%%', labels= vs_label)
plt.title('Direction of All Messages')
plt.show()
plt.close()
outbound_pie_int = [total_sent,total_undelivered,total_delivered]
outbound_pie_label= ['Sent', 'Undelivered', 'Delivered']
my_colors2 = ['lightblue','Red','lightgreen']
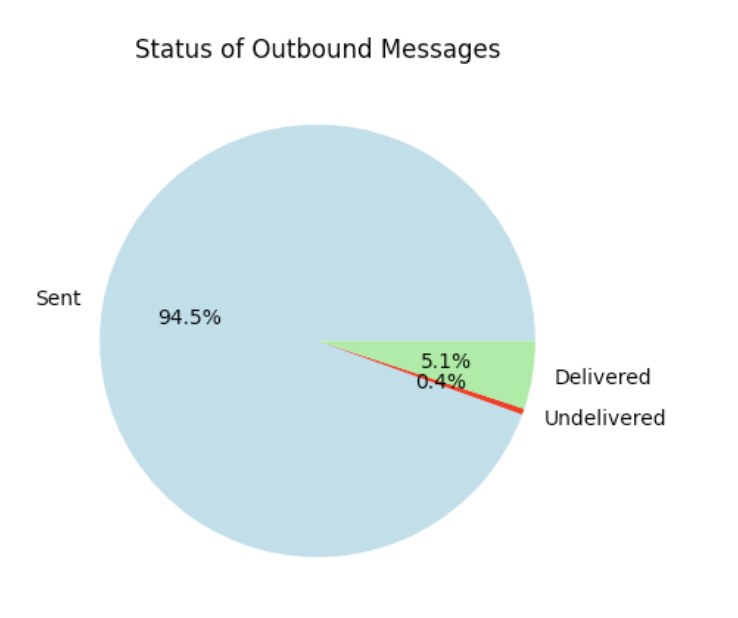
plt.pie(outbound_pie_int, labels=outbound_pie_label,autopct='%1.1f%%', colors=my_colors2)
plt.title('Status of Outbound Messages')
plt.show()
plt.close()
d=[]
numbers = ["+1XXXXXXXXXXX","+1XXXXXXXXXX","+1XXXXXXXXXX","+1XXXXXXXXXX"]
r=[]
sms_in=[]
un_m=[]
for x in numbers:
messages = client.messages.list(
date_sent=datetime(2021, 5, 14, 0, 0),
from_=x)
sms_inbound= client.messages.list(
date_sent=datetime(2021, 5, 14, 0, 0),
to=x)
for record in messages:
r.append((record.status))
the_status= record.status
if the_status =='undelivered':
un_m.append((record.to, record.status, record.sid))
num_sent = int(r.count("sent"))
num_delivered = int(r.count("delivered"))
num_undelivered = int(r.count("undelivered"))
for record in sms_inbound:
sms_in.append((record.status))
num_received= int(sms_in.count("received"))
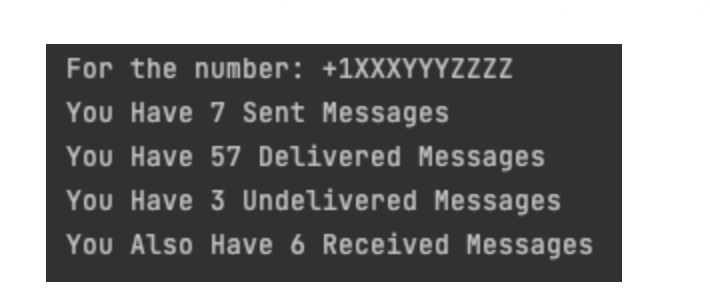
print("For the number:" + str(x))
print("You Have " + str(num_sent) + " Sent Messages")
print("You Have " + str(num_delivered) + " Delivered Messages")
print("You Have " + str(num_undelivered) + " Undelivered Messages")
print("You Also Have " + str(num_received) + " Inbound"+"\n")
r=[]
sms_in=[]
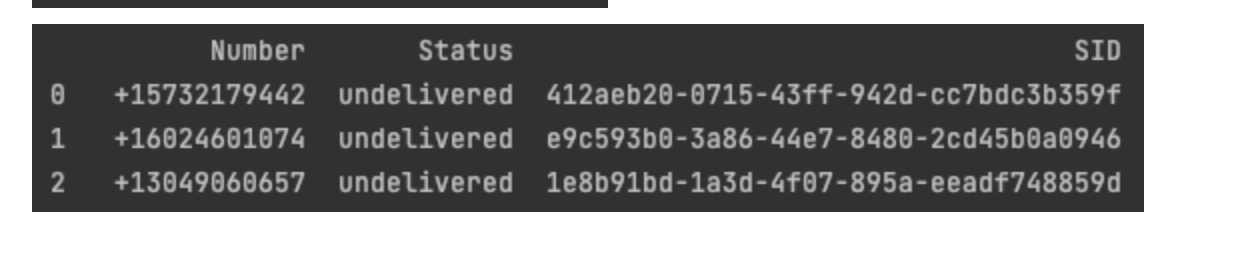
df=pd.DataFrame(un_m, columns=('Number', 'Status', 'SID'))
print(df)
const dfd = require("danfojs");
const fs = require("fs");
const { RestClient } = require("@signalwire/node");
const { plot } = require("nodeplotlib");

// TODO: Update with your credentials
let space_url = "YOURSPACENAME.signalwire.com";
let project_id = "XXXXXXXX-XXXX-XXXX-XXXX-XXXXXXXXXXX";
let access_token = "PTxxxxxxxxxxxxxxxxxxxxxxxxxxxxxxxxxxxxxxxxxxx"

const client = new RestClient(
    project_id,
    access_token,
    { signalwireSpaceUrl: space_url}
);

// TODO: Update numbers list
const from_numbers = [
    "+###########",
    "+###########",
    "+###########",
    "+###########",
];

let total_sent = 0;
let total_received = 0;
let total_delivered = 0;
let total_undelivered = 0;

// Get all messages in the project regtardless of number
client.messages
    .list({
        dateSentAfter: new Date(Date.UTC(2022, 01, 01)),
    })
    .then((messages) =>
        messages.forEach((message) => {
            switch (message.status) {
                case "sent":
                    total_sent++;
                    break;
                case "received":
                    total_received++;
                    break;
                case "delivered":
                    total_delivered++;
                    break;
                case "undelivered":
                    total_undelivered++;
                    break;
            }
        })
    )
    .then(() => {
        num_outbound_messages = total_sent + total_delivered + total_undelivered;
        num_inbound_messages = total_received;

        inbound_outbound = [num_inbound_messages, num_outbound_messages];
        vs_label = ["Inbound", "Outbound"];

        const all_chart = [
            {
                values: inbound_outbound,
                labels: vs_label,
                type: "pie",
                title: "Direction of All Messages",
            },
        ];

        plot(all_chart);

        outbound_pie_int = [total_sent, total_undelivered, total_delivered];
        outbound_pie_label = ["Sent", "Undelivered", "Delivered"];

        const outbound_chart = [
            {
                values: outbound_pie_int,
                labels: outbound_pie_label,
                type: "pie",
                title: "Status of Outbound Messages",
            },
        ];

        plot(outbound_chart);
    });

let undelivered_messages = [];

// Get all messages in the project from the numbers in the from_numbers array
const iterateThroughNumbers = async () => {
    const allNumbersFetched = from_numbers.map(async (number) => {
        let num_sent = 0;
        let num_delivered = 0;
        let num_undelivered = 0;
        let num_received = 0;

        const fromMessagesFetched = new Promise(async (resolve, reject) => {
            client.messages
                .list({
                    from: number,
                    dateSentAfter: new Date(Date.UTC(2022, 01, 01)),
                })
                .then((messages) =>
                    messages.forEach((message) => {
                        switch (message.status) {
                            case "sent":
                                num_sent++;
                                break;
                            case "delivered":
                                num_delivered++;
                                break;
                            case "undelivered":
                                num_undelivered++;
                                undelivered_messages.push([
                                    message.to,
                                    message.status,
                                    message.sid,
                                ]);
                                break;
                        }
                    })
                )
                .then(() => {
                    resolve();
                });
        });

        const toMessagesFetched = new Promise(async (resolve, reject) => {
            client.messages
                .list({
                    to: number,
                    dateSentAfter: new Date(Date.UTC(2022, 01, 01)),
                })
                .then((messages) =>
                    messages.forEach((message) => {
                        if (message.status == "received") {
                            num_received++;
                        }
                    })
                )
                .then(() => {
                    resolve();
                });
        });

        return Promise.all([fromMessagesFetched, toMessagesFetched]).then(
            () => {
                console.log("For the number: " + number);
                console.log("You Have: " + num_sent + " Sent Messages");
                console.log("You Have: " + num_delivered + " Delivered Messages");
                console.log("You Have: " + num_undelivered + " Undelivered Messages");
                console.log("You Also Have " + num_received + " Inbound Messages \n");
            }
        );
    });

    // Wait until all data from all numbers has been fetched before printing list of undelivered messages
    await Promise.allSettled(allNumbersFetched);

    let undelivered_message_data = new dfd.DataFrame(undelivered_messages, {
        columns: ["Number", "Status", "Message SID"],
        config: {
            tableDisplayConfig: {
                columns: [
                    { width: 1 },
                    { width: 13 },
                    { width: 12 },
                    { width: 36}
                ],
            },
        },
    });

    undelivered_message_data.print();
    fs.writeFileSync("UndeliveredMessages.csv", dfd.toCSV(undelivered_message_data));
};

iterateThroughNumbers();
Python
The power of APIs cannot be understated. In this example we are going to create an API request to gather status information on many messages all at once. From this pulled data, this code will also give an introduction to creating plots through matplotlib, creating data frames through pandas, and lastly how to format appropriate data to identify potential issues.
What do I need to run this code?
You must have the SignalWire Python SDK installed. You can install that here:
Python REST API will be used with the assistance of some packages: matplotlib.pyplot, pandas, and datetime. Resources on these will be mentioned below.
Code Walkthrough
We will need to change the following variabled:
-
ProjectID- Your project ID is an alphanumeric string that tells the SignalWire SDK where to find your project. You can find this in an easily copyable format by going to your
SignalWire Portal and clicking the API tab on the lefthand side. -
AuthToken- Your Auth Token is an alphanumeric string that helps to authenticate your HTTP requests to SignalWire. You can create this (if you haven’t already) or copy this in an easily copyable format by going to your SignalWire Portal and clicking the API tab. If you have not created an API token, press the blue new button. If you have, click show and copy the string. -
SpaceURL- Your Space URL is the domain of your Space, i.e. example.signalwire.com. This can also be found in an easily copyable format within the API tab in your SignalWire Space.
Change the date and from number when calling clients.messages.list() to specify the date range and from number that you need. If you are filtering by another parameter, you can add it within client.messages.list()
Numbers– Populate the ‘numbers’ array towards the end of the code, with the numbers that you are wanting to analyze. These must be formatted as ‘+1XXXYYYZZZZ’
from signalwire.rest import Client as signalwire_client
import matplotlib.pyplot as plt
import pandas as pd
from datetime import datetime


client = signalwire_client("AAAAAAAA-BBBB-CCCC-DDDD-EEEEEEEEEEEE", "PTXXXXXXXXXXXXXXXXXXXXXXXXXXXXXXXXXXXXXXXXXXXX", signalwire_space_url = 'EXAMPLE.signalwire.com')

# List All Messages Sent on 5/14/2021
all_messages = client.messages.list(
                    date_sent=datetime(2021, 5, 14, 0, 0),
                                    )

# Create an array listing the status of each message listed
all=[]
for record in all_messages:
        all.append((record.status))

#Count how many of each Status is in 'all' array. Transfer Variables to Int
total_sent=int(all.count("sent"))
total_received=int(all.count("received"))
total_delivered=int(all.count("delivered"))
total_undelivered=int(all.count("undelivered"))

#Calculate Total Number Inbound and Outbound Messages
num_outbound_messages = total_sent + total_delivered + total_undelivered
num_inbound_messages = total_received

#Inbound vs Outbound Messages Pie Chart
inbound_outbound = [num_inbound_messages , num_outbound_messages]
my_colors = [ 'blue', 'grey']
vs_label = ['Inbound', 'Outbound']

plt.pie( inbound_outbound, colors= my_colors , autopct='%1.1f%%', labels= vs_label)
plt.title('Direction of All Messages')
plt.show()
plt.close()


## Status of Outbound Messages Pie Chart
outbound_pie_int = [total_sent,total_undelivered,total_delivered]
outbound_pie_label= ['Sent', 'Undelivered', 'Delivered']
my_colors2 = ['lightblue','Red','lightgreen']

plt.pie(outbound_pie_int, labels=outbound_pie_label,autopct='%1.1f%%', colors=my_colors2)
plt.title('Status of Outbound Messages')
plt.show()
plt.close()


## Print out Some Stats

# Previously, we looked at all numbers, now we are going to narrow in on a few numbers
d=[]
# List Numbers for Testing
numbers = ["+1XXXXXXXXXXX","+1XXXXXXXXXX","+1XXXXXXXXXX","+1XXXXXXXXXX"]

# Array that list's status of Messages from 'Numbers'
r=[]
# Array that list's Inbound Messages to 'Numbers'
sms_in=[]
#Array used for All Undelivered Messages in Space
un_m=[]

for x in numbers:
    # Listing all Messages from every number listed on the date 5/16/2021
    messages = client.messages.list(
                               date_sent=datetime(2021, 5, 14, 0, 0),
                               from_=x)
    # Listing all Messages to every number listed on the date 5/16/2021
    sms_inbound= client.messages.list(
                               date_sent=datetime(2021, 5, 14, 0, 0),
                               to=x)

# Append our Matrix with the Status of every outbound message
    for record in messages:
            r.append((record.status))
            the_status= record.status

            if the_status =='undelivered':
                un_m.append((record.to, record.status, record.sid))


    num_sent = int(r.count("sent"))
    num_delivered = int(r.count("delivered"))
    num_undelivered = int(r.count("undelivered"))

    for record in sms_inbound:
                sms_in.append((record.status))

                num_received= int(sms_in.count("received"))

    print("For the number:" + str(x))
    print("You Have " + str(num_sent) + " Sent Messages")
    print("You Have " + str(num_delivered) + " Delivered Messages")
    print("You Have " + str(num_undelivered) + " Undelivered Messages")
    print("You Also Have " + str(num_received) + " Inbound"+"\n")

    r=[]
    sms_in=[]

df=pd.DataFrame(un_m, columns=('Number', 'Status', 'SID'))
print(df)
Sample Outputs
Node.js
What do I need to run this code?
We will need the following libraries (click their names to get instructions on how to install them):
- Danfo.js
- fs - there is no need to install this module, as it is part of the Node.js Core
- SignalWire Rest Client
- nodeplotlib
How to Run Snippet?
If you save this code snippet in a file called messagingStatistics.js, for example, you then need to run:
node messagingStatistics.js.
Code Walkthrough
Load the necessary libraries
const dfd = require("danfojs");
const fs = require("fs");
const { RestClient } = require("@signalwire/compatibility-api");
const { plot } = require("nodeplotlib");
Instantiate the SignalWire Rest Client
In order for us to connect to SignalWire later on in the code using the Rest Client we first need to make sure we update space_url, project_id, and access_token.
// TODO: Update with your credentials
let space_url = "YOURSPACENAME.signalwire.com";
let project_id = "XXXXXXXX-XXXX-XXXX-XXXX-XXXXXXXXXXX";
let access_token = "PTxxxxxxxxxxxxxxxxxxxxxxxxxxxxxxxxxxxxxxxxxxx";

const client = RestClient(project_id, access_token, {
  signalwireSpaceUrl: space_url,
});
Set the numbers to look for
In this step we need to create the from_numbers array, that should contain the numbers we want to filter by.
Make sure to update the from_numbers array with your list of numbers, in E.164 format.
const from_numbers = [
  "+###########",
  "+###########",
  "+###########",
  "+###########",
];
Create necessary variables
Here we create the variables that we're going to be incrementing to keep track of the various statuses as we go through all of the messages in the next step.
let total_sent = 0;
let total_received = 0;
let total_delivered = 0;
let total_undelivered = 0;
Get all messages in the project regardless of number
Using the List Messages endpoint, through client.messages.list, and specifying only the dateSentAfter parameter, we get a list of all messages in this project since that date.
After we get the list of messages back, depending on the message status, we increment the counts of each of them.
client.messages
  .list({
    dateSentAfter: new Date(Date.UTC(2022, 01, 01)),
  })
  .then((messages) =>
    messages.forEach((message) => {
      switch (message.status) {
        case "sent":
          total_sent++;
          break;
        case "received":
          total_received++;
          break;
        case "delivered":
          total_delivered++;
          break;
        case "undelivered":
          total_undelivered++;
          break;
      }
    })
  );
Handle message data regardless of number
After all messages are handled, using the counts of the statuses we gathered in the previous step, we then set up two charts:
- Direction of All Messages -> Compares Inbound and Outbound traffic
- Status of Outbound Messages -> Compares the prevalence of Sent, Undelivered, and Delivered statuses
.then(() => {
        num_outbound_messages = total_sent + total_delivered + total_undelivered;
        num_inbound_messages = total_received;

        inbound_outbound = [num_inbound_messages, num_outbound_messages];
        vs_label = ["Inbound", "Outbound"];

        const all_chart = [
            {
                values: inbound_outbound,
                labels: vs_label,
                type: "pie",
                title: "Direction of All Messages",
            },
        ];

        plot(all_chart);

        outbound_pie_int = [total_sent, total_undelivered, total_delivered];
        outbound_pie_label = ["Sent", "Undelivered", "Delivered"];

        const outbound_chart = [
            {
                values: outbound_pie_int,
                labels: outbound_pie_label,
                type: "pie",
                title: "Status of Outbound Messages",
            },
        ];

        plot(outbound_chart);
    });
Handle message data from the numbers in the from_numbers array
In this step we start by creating the undelivered_messages array, which we'll use to store all undelivered message data.
We create a function called iterateThroughNumbers, and inside it we create allNumbersFetched, responsible for looping through the from_numbers array. Then, inside allNumbersFetched, we create two Promises: fromMessagesFetched and toMessagesFetched so can keep track of the separate requests we're making to the client.
fromMessagesFetched and toMessagesFetched are responsible for going over each status and incrementing the respective counter variables. Additionally, and only in messages with the status is undelivered, we add them to the undelivered_messages array.
Only once the fromMessagesFetched and toMessagesFetched Promises are fulfilled for each number do we print out that particular number's results.
Lastly, once all numbers have been fetched, its Promise is fulfilled and we can finally print out all of the undelivered message data across all numbers. To assist in exporting the data, we create the undelivered_message_data DataFrame, print it to the terminal, and then convert it to a CSV format in the UndeliveredMessages.csv file.
let undelivered_messages = [];

// Get all messages in the project from the numbers in the from_numbers array
const iterateThroughNumbers = async () => {
  const allNumbersFetched = from_numbers.map(async (number) => {
    let num_sent = 0;
    let num_delivered = 0;
    let num_undelivered = 0;
    let num_received = 0;

    const fromMessagesFetched = new Promise(async (resolve, reject) => {
      client.messages
        .list({
          from: number,
          dateSentAfter: new Date(Date.UTC(2022, 01, 01)),
        })
        .then((messages) =>
          messages.forEach((message) => {
            switch (message.status) {
              case "sent":
                num_sent++;
                break;
              case "delivered":
                num_delivered++;
                break;
              case "undelivered":
                num_undelivered++;
                undelivered_messages.push([
                  message.to,
                  message.status,
                  message.sid,
                ]);
                break;
            }
          })
        )
        .then(() => {
          resolve();
        });
    });

    const toMessagesFetched = new Promise(async (resolve, reject) => {
      client.messages
        .list({
          to: number,
          dateSentAfter: new Date(Date.UTC(2022, 01, 01)),
        })
        .then((messages) =>
          messages.forEach((message) => {
            if (message.status == "received") {
              num_received++;
            }
          })
        )
        .then(() => {
          resolve();
        });
    });

    return Promise.all([fromMessagesFetched, toMessagesFetched]).then(() => {
      console.log("For the number: " + number);
      console.log("You Have: " + num_sent + " Sent Messages");
      console.log("You Have: " + num_delivered + " Delivered Messages");
      console.log("You Have: " + num_undelivered + " Undelivered Messages");
      console.log("You Also Have " + num_received + " Inbound Messages \n");
    });
  });

  // Wait until all data from all numbers has been fetched before printing list of undelivered messages
  await Promise.allSettled(allNumbersFetched);

  let undelivered_message_data = new dfd.DataFrame(undelivered_messages, {
    columns: ["Number", "Status", "Message SID"],
    config: {
      tableDisplayConfig: {
        columns: [{ width: 1 }, { width: 13 }, { width: 12 }, { width: 36 }],
      },
    },
  });

  undelivered_message_data.print();
  fs.writeFileSync(
    "UndeliveredMessages.csv",
    dfd.toCSV(undelivered_message_data)
  );
};

iterateThroughNumbers();
Wrap up
This code introduced to you three different techniques to view information given by SignalWire CXML APIs. We learned how to create a plot through matplotlib/nodeplotlib, how to create a data table through pandas/danfojs, and lastly how to declare variables to further print out console friendly outputs!
Sign Up Here
If you would like to test this example out, create a SignalWire account and Space.
Please feel free to reach out to us on our Community Slack or create a Support ticket if you need guidance!